Metrics
Device Metrics refer to data points and measurements that provide insights into the performance, availability, and efficiency of your devices and device cloud. Metrics are essential for monitoring and managing your devices and ensuring the overall health of your device pool.
The Ioto service provides a set of standard metrics and you can create custom metrics based on your device specific data.
Using device data that is synchronized to the cloud from your devices, you can automatically create custom metrics from the data stream.
Metric Timespans
When the Ioto service creates metrics, it keeps the current live value and stores the historical metric values so you can monitor historical trends. Ioto metrics automatically calculate statistics for the last "5 minutes", "hour", "day", "week" "month", or "year".
These metrics can then be monitored, displayed by the Device Manager as a single metric value or as set of values over time as a graph.
Metric Statistics
For each timespan, you can query the average, minimum, maximum or sum value for the metric.
Metric Naming
Metrics are scoped via a set of naming properties including:
- namespace
- metric name
- dimensions
The namespace is a global name to group related metrics. Currently, this must be set to Embedthis/Device.
The metric name is the specific metric name. For example: a device's temperature.
The dimensions select specific instances of a metric. For example, each device may have a temperature metric and we may also have an overall device pool average temperature metric.
Ioto treats each unique combination of dimensions as a separate metric. Enter the dimensions as a comma separated list of dimensions. For example:
dimensions = "Process,Module"
Defining Metrics
Metrics are defined via the Database schema definition. In the process section for a schema model, define a metrics array of metric definitions. Each definition selects a data item value to be converted to a metric.
For example:
This will create a Temperature metric in the Embedthis/Device namespace based upon the database item's temp attribute.
Metric definitions may contain the following properties:
| Property | Type | Description |
|---|---|---|
| buffer | map |
Metric buffering directives. Defaults to null |
| dimensions | array |
Array of metric dimensions. Defaults to null |
| fields | array |
Array of metrics to create. Array metric entries may contain field attribute names or a map of a field attribute to a metric name. |
| namespace | string |
Metric namespace for the metric. Must be set to 'Embedthis/Device'. |
| where | string |
Conditional expression to select items for which to create metrics. |
The metric namespace scopes the metrics and must be set to 'Embedthis/Device'. Other namespaces may be supported in the future.
The fields property contains an array with one or more metric definitions. Each definition may be either:
- An item attribute name which is used to identify the value AND to name the metric.
- A map of an item attribute name to a metric name.
For example:
This would create three metrics using the item's temperature, status and speed attributes. The metrics would take the same name.
Wheras:
This would create the metrics: Temp, Online and Level from the temperature, status and speed item attributes.
The dimensions property contains an array of dimensions that scope the metric. The elements of the dimensions array can be either field names or objects that map field names into a dimension name. If the values are quoted, they are used as literal values. If unquoted, they are regarded as database item field names.
For example:
Where Expressions
The where property can be used to select matching device database items (rows) from which to create the metric.
The where query language is based on familiar Javascript expressions with some additional operators. Item attributes are expressed as variable names and literal values are expressed as JavaScript values.
For example: the expression:
1 | |
will select those items which have the error attribute set to "critical" and the component attribute set to "PS1".
The query language supports the operators: + - * / ( ) ^ ! % == != < <= > >= ^= ^!= $= $!= << >> && || <> ><
These extension operators have the following meaning a ^= b a starts with the string b a ^!= b a does not start with the string b a $= b a ends with the string b a $!= b a does not end with the string b a >< b a contains the string b a <> b a does not contain the string b
Sub-expressions can be grouped with parenthesis and the boolean operators && and || can group conditional operands.
Regular expressions (delimited by slashes) may be used with the "==" and "!=" operators. The regular expression can be on either side of the operator.
The query language understands the types: Numbers, Boolean, String literals, Regular Expressions and null.
For example:
Metric API
Metrics can also be created in the Embedthis/Device namespace by using the Ioto Agent ioSetMetric API.
For example:
Then to read the metric in the agent:
Displaying Metrics
The Device Manager can display metric data via graphical widgets
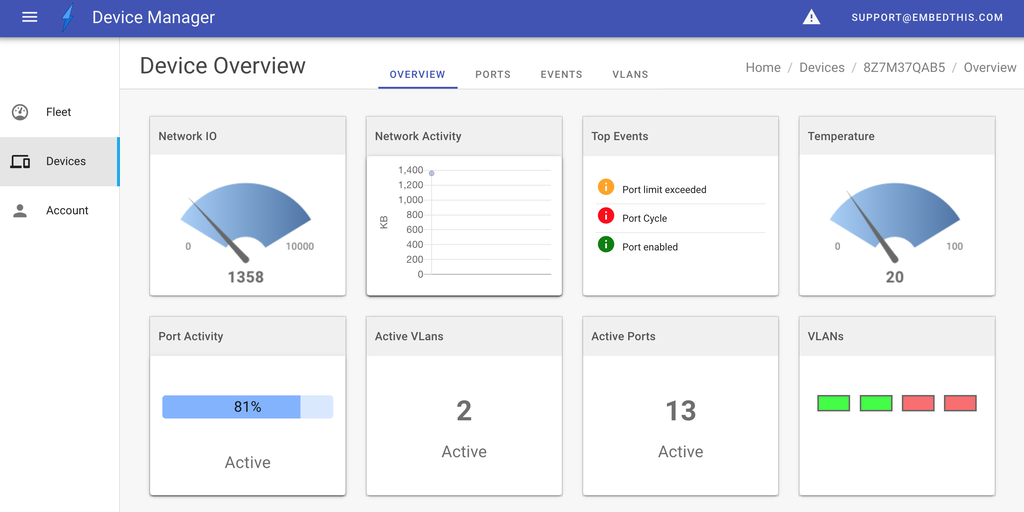
You can select from the following widget types:
- gauge
- graph
- table
- progress
- number
- leds
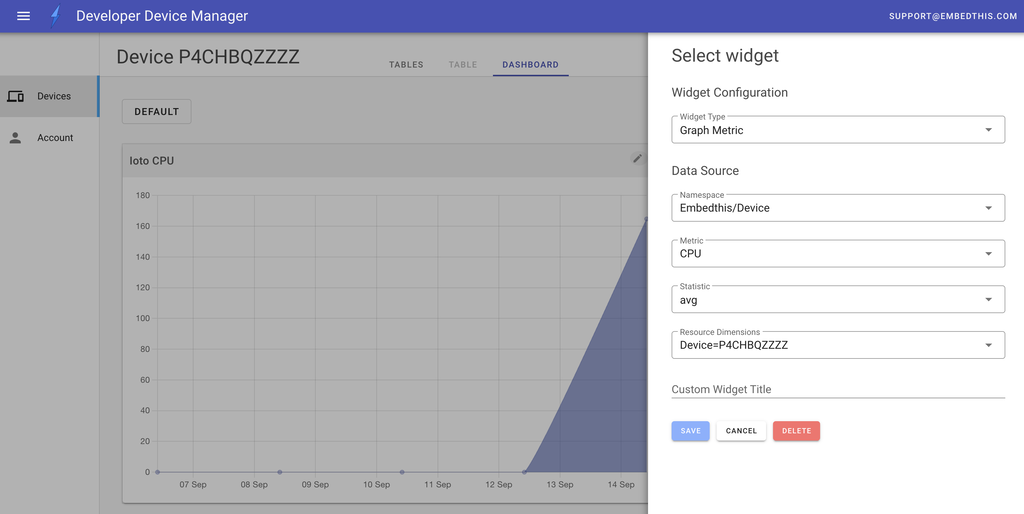
When creating or modifying a widget, you can select the data source to be either a database table item or a metric.
When selecting a metric, you enter the metric name, statistic and resource dimensions.
When selecting data directly from the database, you enter the database table model name, the model field (attribute) and a row selection expression.
Standard Metrics
The Ioto service computes standard metrics for each device cloud using the Embedthis/Ioto namespace.
| Metric | Dimensions | Description |
|---|---|---|
| DevicesMade | Product:PRODUCT | Number of devices manufactured this month |
| DevicesClaimed | Product:PRODUCT | Number of devices claimed for cloud-based management this month |
| DevicesConnected | Number of devices connecting to the cloud this month | |
| MsgIn | Number of messages received by the cloud | |
| MsgOut | Number of messages sent by the cloud | |
| Throttles | Number of times a device sending too much data was throttled | |
| SyncIn | Number of database synchronization messages sent to the cloud | |
| SyncOut | Number of database synchronziation messages sent to devices |
Custom Metrics
Custom metrics created from device data streams are created using the Embedthis/Device namespace.