Builder Dashboard
EmbedThis Builder offers customizable dashboards that display comprehensive metrics for your Ioto-based device clouds. Both Builder and Ioto services generate an extensive array of metrics, allowing you to monitor the performance of your devices and device clouds effectively.
These dashboards are highly adaptable; you can integrate widgets from the EmbedThis Ioto service, various AWS services, and even your own custom AWS CloudWatch metrics. Widgets can be added, removed, repositioned, and resized to meet your specific requirements.
Additionally, you can create multiple dashboards to concentrate on different operational aspects of your device clouds and device fleets.
Builder Dashboards offer support for:
- Graphical widgets such as graphs, gauges, and numeric and text displays.
- Customizable layouts with adjustable positioning and sizing of widgets.
- Responsive designs that adapt to various screen sizes.
- Creation of multiple dashboards, each focusing on different aspects of services.
- A gallery featuring additional widgets and data sources.
- An extensive library of pre-configured widget sets tailored to various AWS services.
- The ability to save and share dashboard configurations with team members in your organization.
Widgets
The Builder supports a suite of widget types including: gauges, graphs, log and lambda views, numeric and text widgets and a top alerts widget.
You can configure widgets to display data from EmbedThis Ioto and most AWS services including: API Gateway, Billing, Certificate Manager, CloudFront, Cognito, CloudWatch Logs, DynamoDB, EventBridge, Lambda, Lambda Insights, Route53, S3, SES, SNS, States, Usage, X-Ray as well as your custom CloudWatch metrics.
Adding Widgets
To add widgets to the dashboard, click on the "Add Widget" button which will display the widget slide-out panel. From this panel, you can select your widget type and the wizard will then prompt for the required fields.
If you have created a Dedicated Device Cloud, you can select a service overview, you can choose from overviews for AWS billing, CloudWatch, DynamoDB, EventBridge, Lambda, SES or SNS.

Layout
You can adjust the layout of widgets on the dashboard by moving and resizing them. To move a widget, click and drag it from the title area to a new location. To resize a widget, click and drag the resize handle located at the bottom left corner to your preferred size. As you move or resize widgets, the dashboard automatically rearranges other widgets to prevent overlap and ensure clear visibility.
To remove a widget, click the (x) icon in the top left corner of the widget.
Zooming a Widget
If you double click a widget, it will be zoomed to full screen display. Click escape or click outsize the widget to restore it to normal size.
Dashboard Navbar
The dashboard navbar provides icons and buttons to modify the dashboard.
The following icons are provided:
| Icon | Description |
|---|---|
| Pencil | Open the Dashboard Panel to modify the dashboard |
| Timer | Countdown timer to the next widget data refresh |
| Compact | Compact the current widgets to remove superfluous space |
| Expand | Expand widget rows and align to fill the available browser window space |
| Reset | Reset the current layout and discard unsaved changes |
| Plus | Open the Widget Panel to add a new widget to the dashboard |
Snap to Grid
The Dashboard will align widgets to a 20 pixel grid when the Snap to Grid dashboard option is selected in the dashboard panel. New dashboards will by default enable the grid.
After creating a dashboard, it is useful to deselect the Snap to Grid so that that dashboard widgets will remain aligned if the browser window is resized.
Compacting Widgets
The compact icon will compact widgets and remove extra space. If your dashboard is using the "Snap to Grid" option, the widgets will be aligned on the 20 pixel grid.
Expanding Widgets
The Expand widget option will expand each row of widgets to utilize all available space. This will bypass the alignment grid so that the right hand edge of the widgets will align. After expanding, it can be helpful to deselect the dashboard "Snap to Grid" so that the widgets remain aligned.
Resetting the Dashboard
When the reset icon is clicked, all unsaved changes will be discarded.
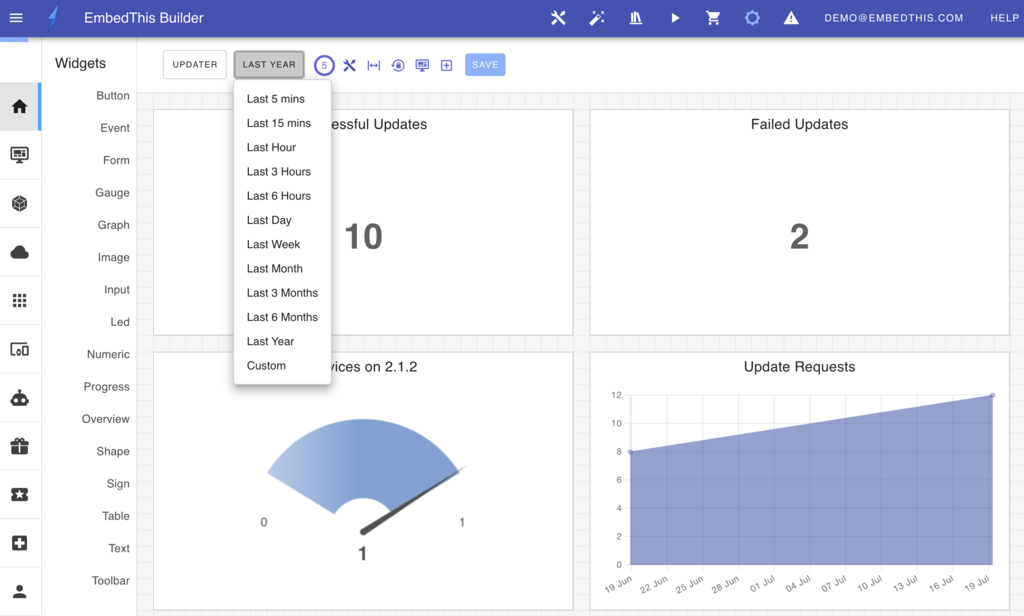
Metric Period
You can customize the data period for the graphs and metrics displayed on the dashboard. At the top center-right of the page, you can select the period to be per hour, day, week, month or custom period using the period button at the top right.
Saving and Sharing
Dashboards may be saved and shared among team members.
When you make a modification to the dashboard such as resizing a widget or moving its position, a "Save" button will appear. Clicking save will persist the layout and set it as the new default layout for you and all other team members.

Creating and Selecting Dashboards
You can create multiple dashboards that focus on different service aspects. For example, you may want a dashboard that features service load graphs and metrics and another dashboard to focus on outages and errors.
You can easily switch between dashboards by clicking on the name of the dashboard in the top left of the home page.

To create a new dashboard, select "New Dashboard" to display the dashboard slide out panel. Then enter your desired dashboard name and configuration.